We keep receiving one question in our Facebook group, on Twitter/X, and when we attend any events – “Is now a better time to buy or sell a content website?”. And we have to say, it’s a great question, as every market shifts over time due to industry and economic changes.
When we started selling websites through Motion Invest in 2019, the market was red-hot, Amazon Affiliates paid higher commission rates, and AI content was few and far between. This created a thriving market for sellers, as revenue was higher, and the threat of competition was low.
Now, competition is higher, AI content is everywhere, and site owners have likely gone through the heartbreak of a traffic drop due to a Helpful Content Update. With all these factors becoming increasingly prominent over the last couple of years, it seems natural to think that site valuation has changed.
To find the current state of the market, we have closely analyzed numbers from our marketplace, EmpireFlippers, and other public sources to accurately determine changes and the current state of supply, demand, and valuation for content websites.
Here is what we found out.
Table of Contents
ToggleIf you don’t want to read the whole analysis, here are our biggest findings:
Without wasting any more time, let’s dig into the numbers and share what we have learned about how valuations, supply, and demand have changed over the years.
We want to start this study by examining website valuation over the past few years, as price significantly determines whether we are in a buyer’s or seller’s market.
To do this, we will be looking at the average income multiple for websites sold. For those unaware, a website’s income multiple is how many months of income (after expenses) it will take to equal the sales price. So when we say something is selling at a 30x multiple, it means it will take 30 months to break even.
We chose to look at website multiples first, as it gives us a better understanding of how buyers and sellers are valuing websites. When demand is high and supply is low, website multiples are higher. On the flip side, when inventory is high and demand is low, website multiples will be lower.
Upon digging through our numbers for the past five years, this is what we found.
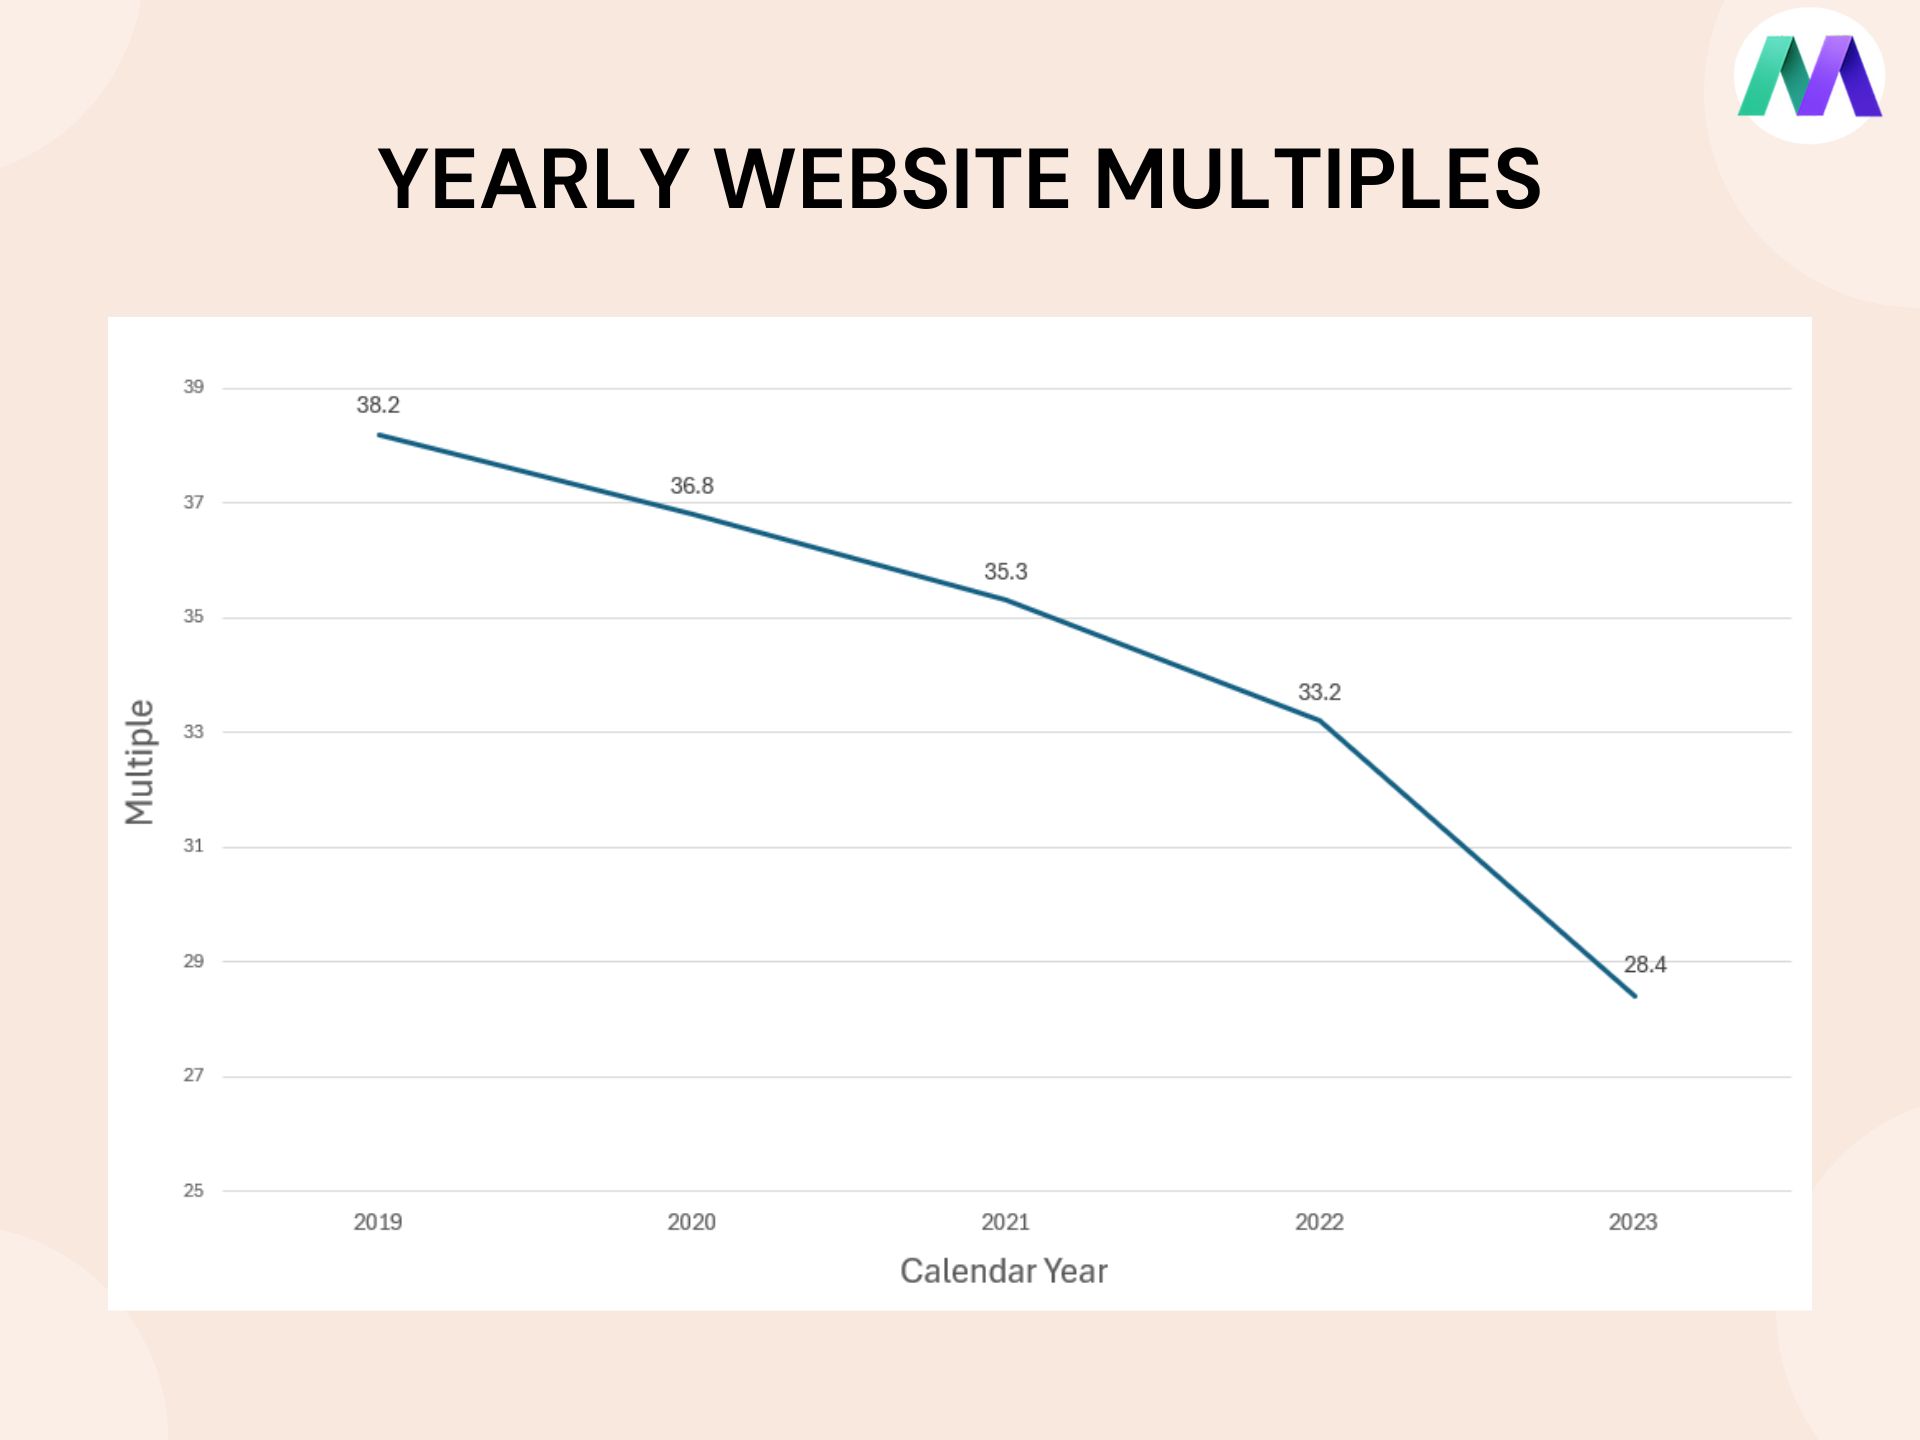
The exact numbers are:
Before drawing any conclusions, we also wanted to get a better understanding of multiples across the industry, so we have also looked at the Empire Flippers Scoreboard.
Caveat time – To do this for previous years, we had to use the Wayback Machine and analyze previous editions of the scoreboard. Therefore, this data will not be 100% accurate, as we cannot view the scoreboard on the same day of every calendar year.
However, we did our best to keep the timelines as close to 1 year apart in the name of statistical accuracy.
Here is what it looks like on a graph.
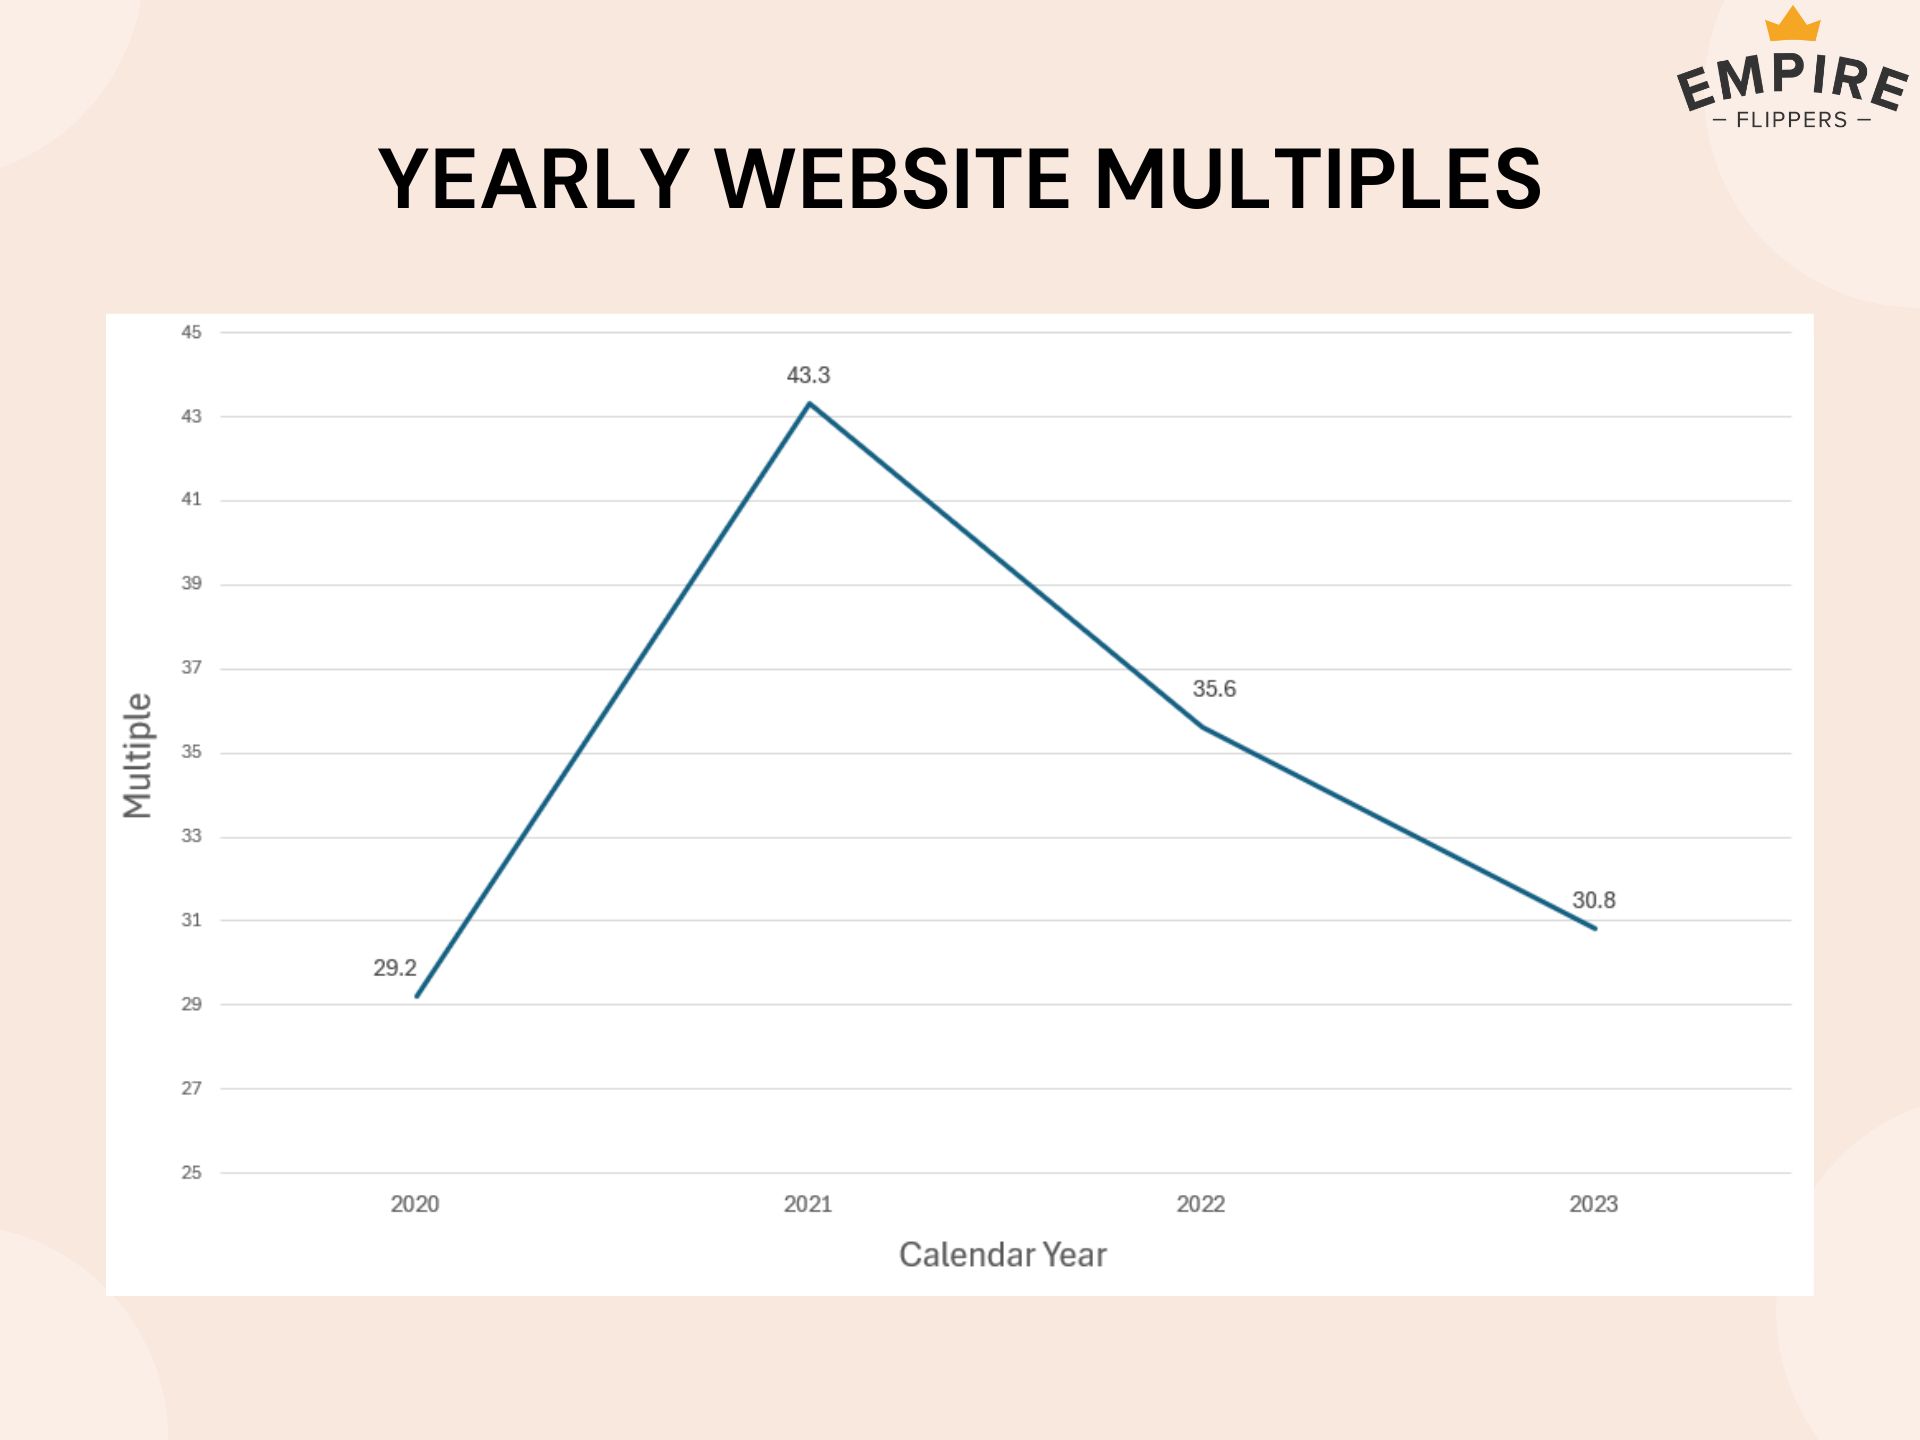
The exact numbers are:
Lots of factors can impact valuation, but we take the decrease in website multiples as a clear sign that the market has shifted from a seller’s market to a buyer’s market, as you can now purchase a similar site for almost half the price that it would be valued in 2021.
Key Takeaway – Website multiples have sharply dropped in the past two years, and are now close to 30x on Empire Flippers and on Motion Invest.
Website multiples are a good indicator for valuation, as more demand means higher site multiples. But, we wanted to look at a few other stats to get a more detailed understanding of supply and demand.
To start, we looked at the number of days spent in our marketplace to gauge how quickly websites are selling now compared to the past.
We believe that if the market is hot, sites sell quicker, and spend less time in our marketplace. Let’s see what the stats say.
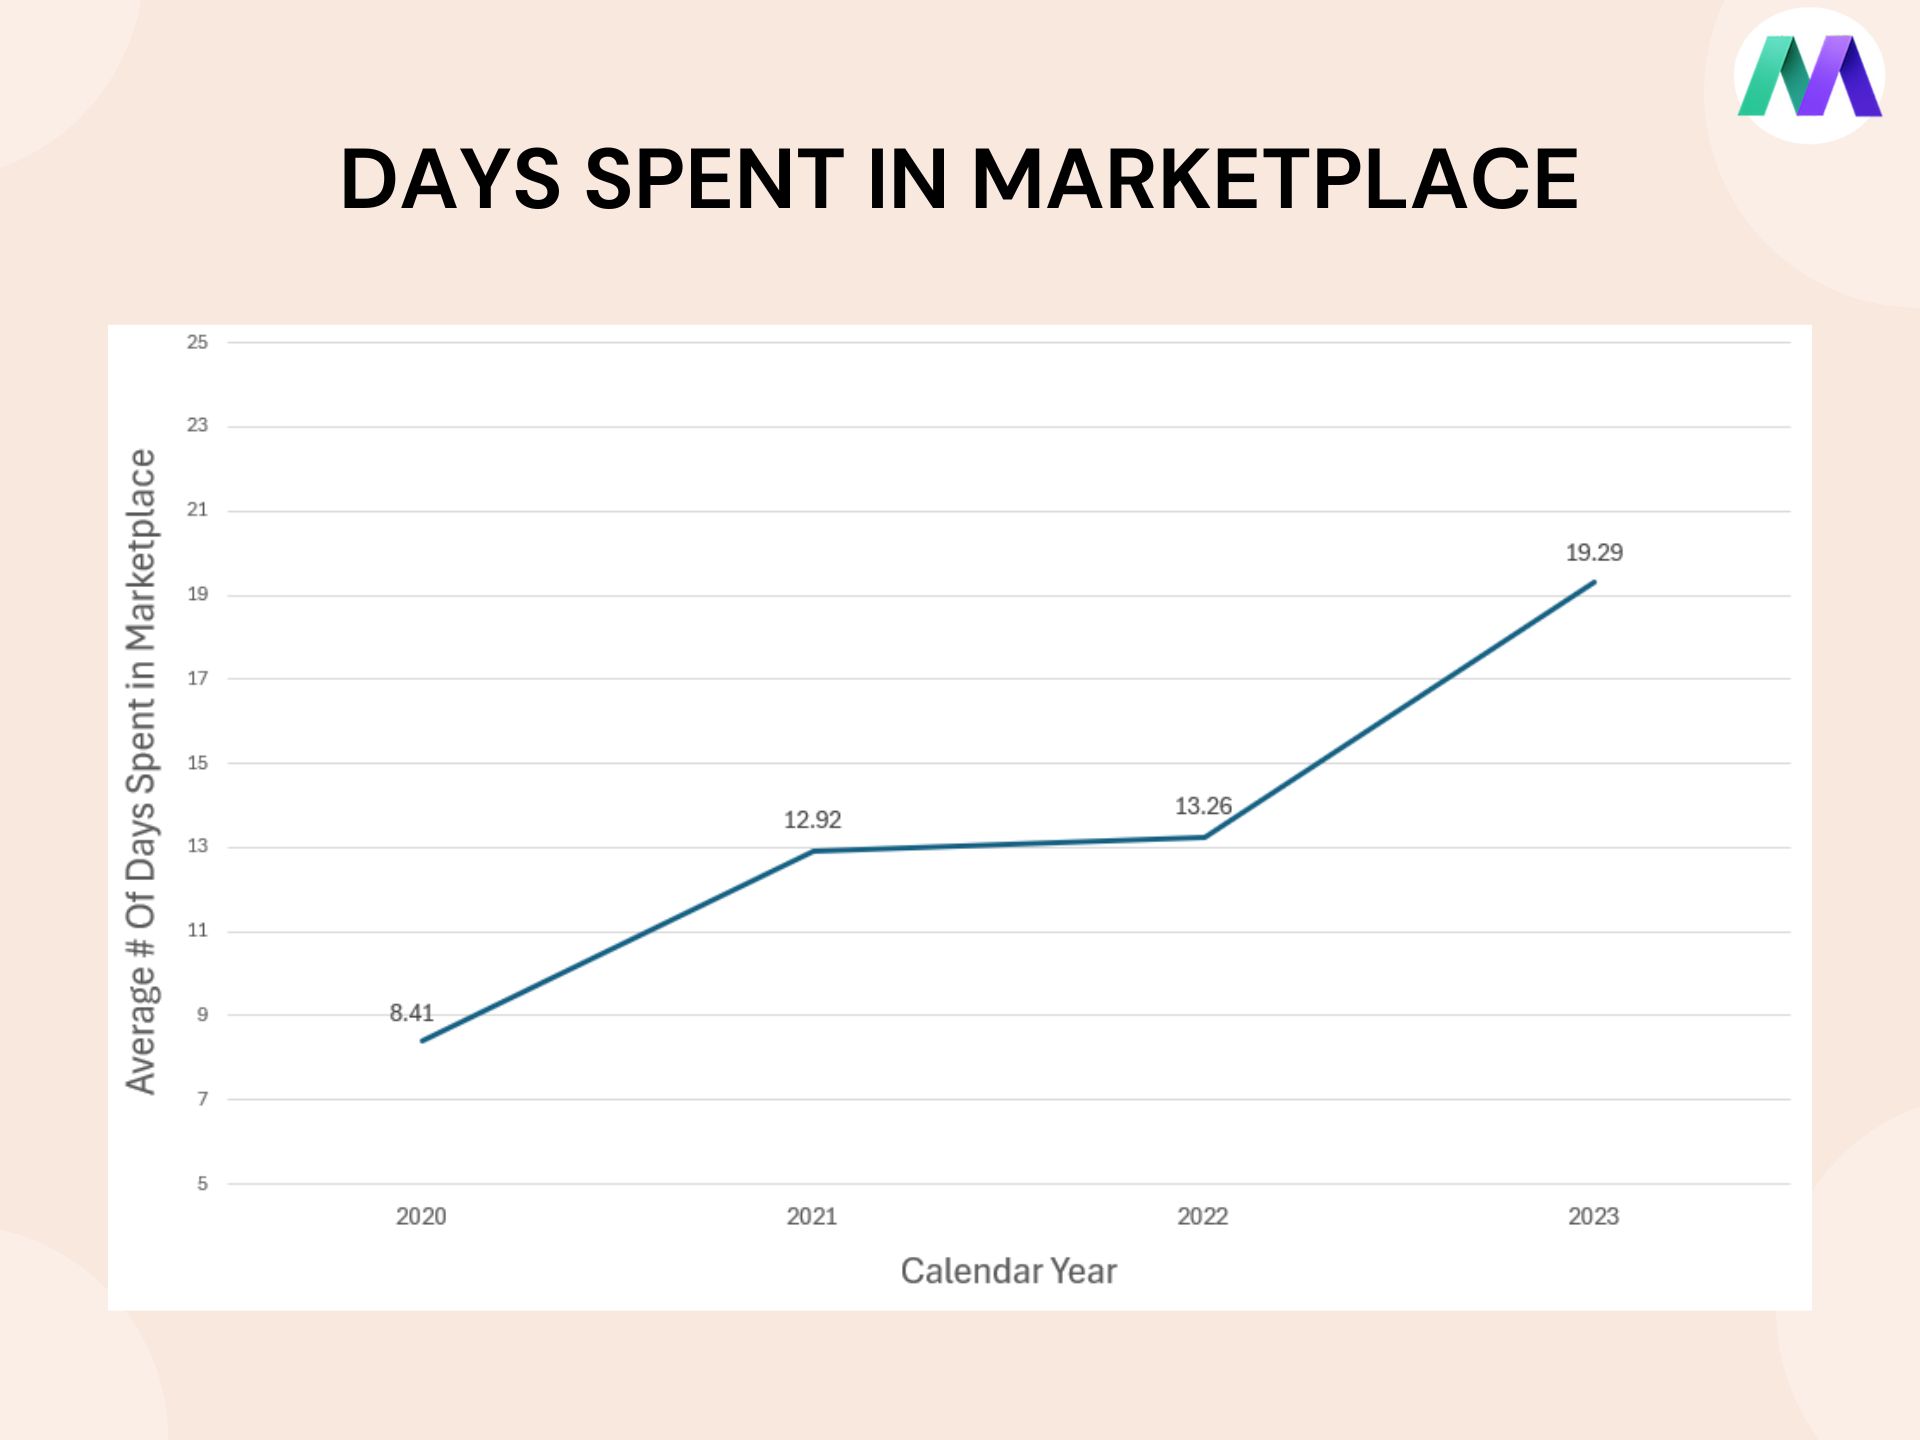
The exact numbers are:
From this statistic, we can see that sites are now taking twice as long to sell in 2023 as they were in 2020. To us, this shows that there is less urgency and competition in the marketplace.
Next, let’s take a look at the number of websites sold in our marketplace to get a feel for overall activity.
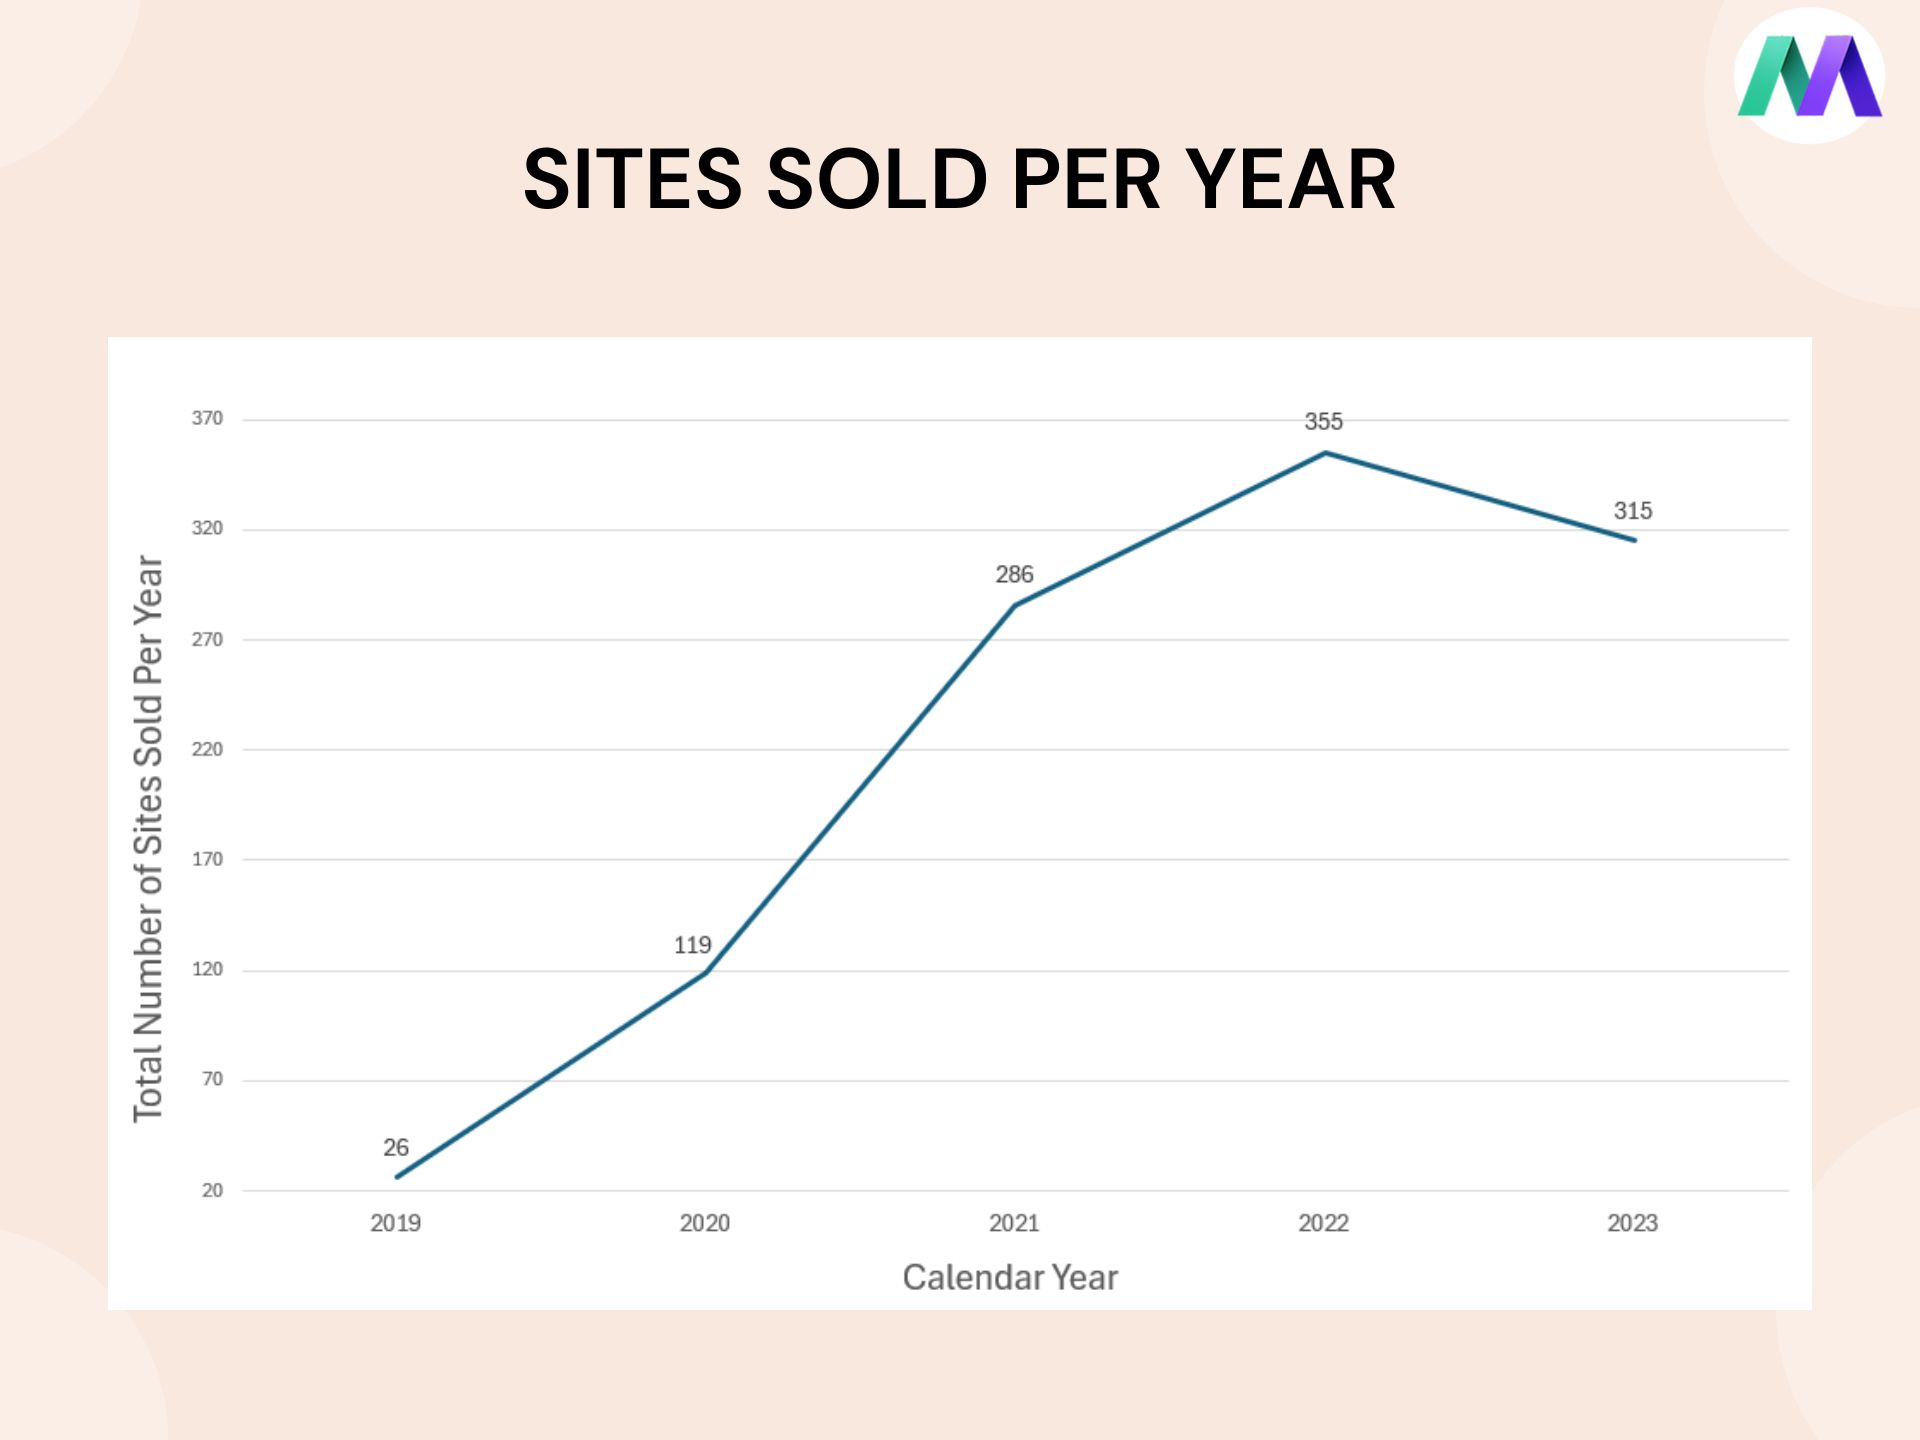
The exact numbers are:
Upon reviewing this statistic, it is hard to draw any conclusions. The number of sites sold has been relatively consistent for the past three years, and it’s hard to say if 2022 will be the peak, because overall, buying and selling activity remains strong.
To add some clarity to this statistic, we thought it would be worth analyzing the total sales volume for each year. This adds a bit more detail to the number of sites sold, by also including the total value of the sites sold.
Here is what we found in our Motion Invest stats.
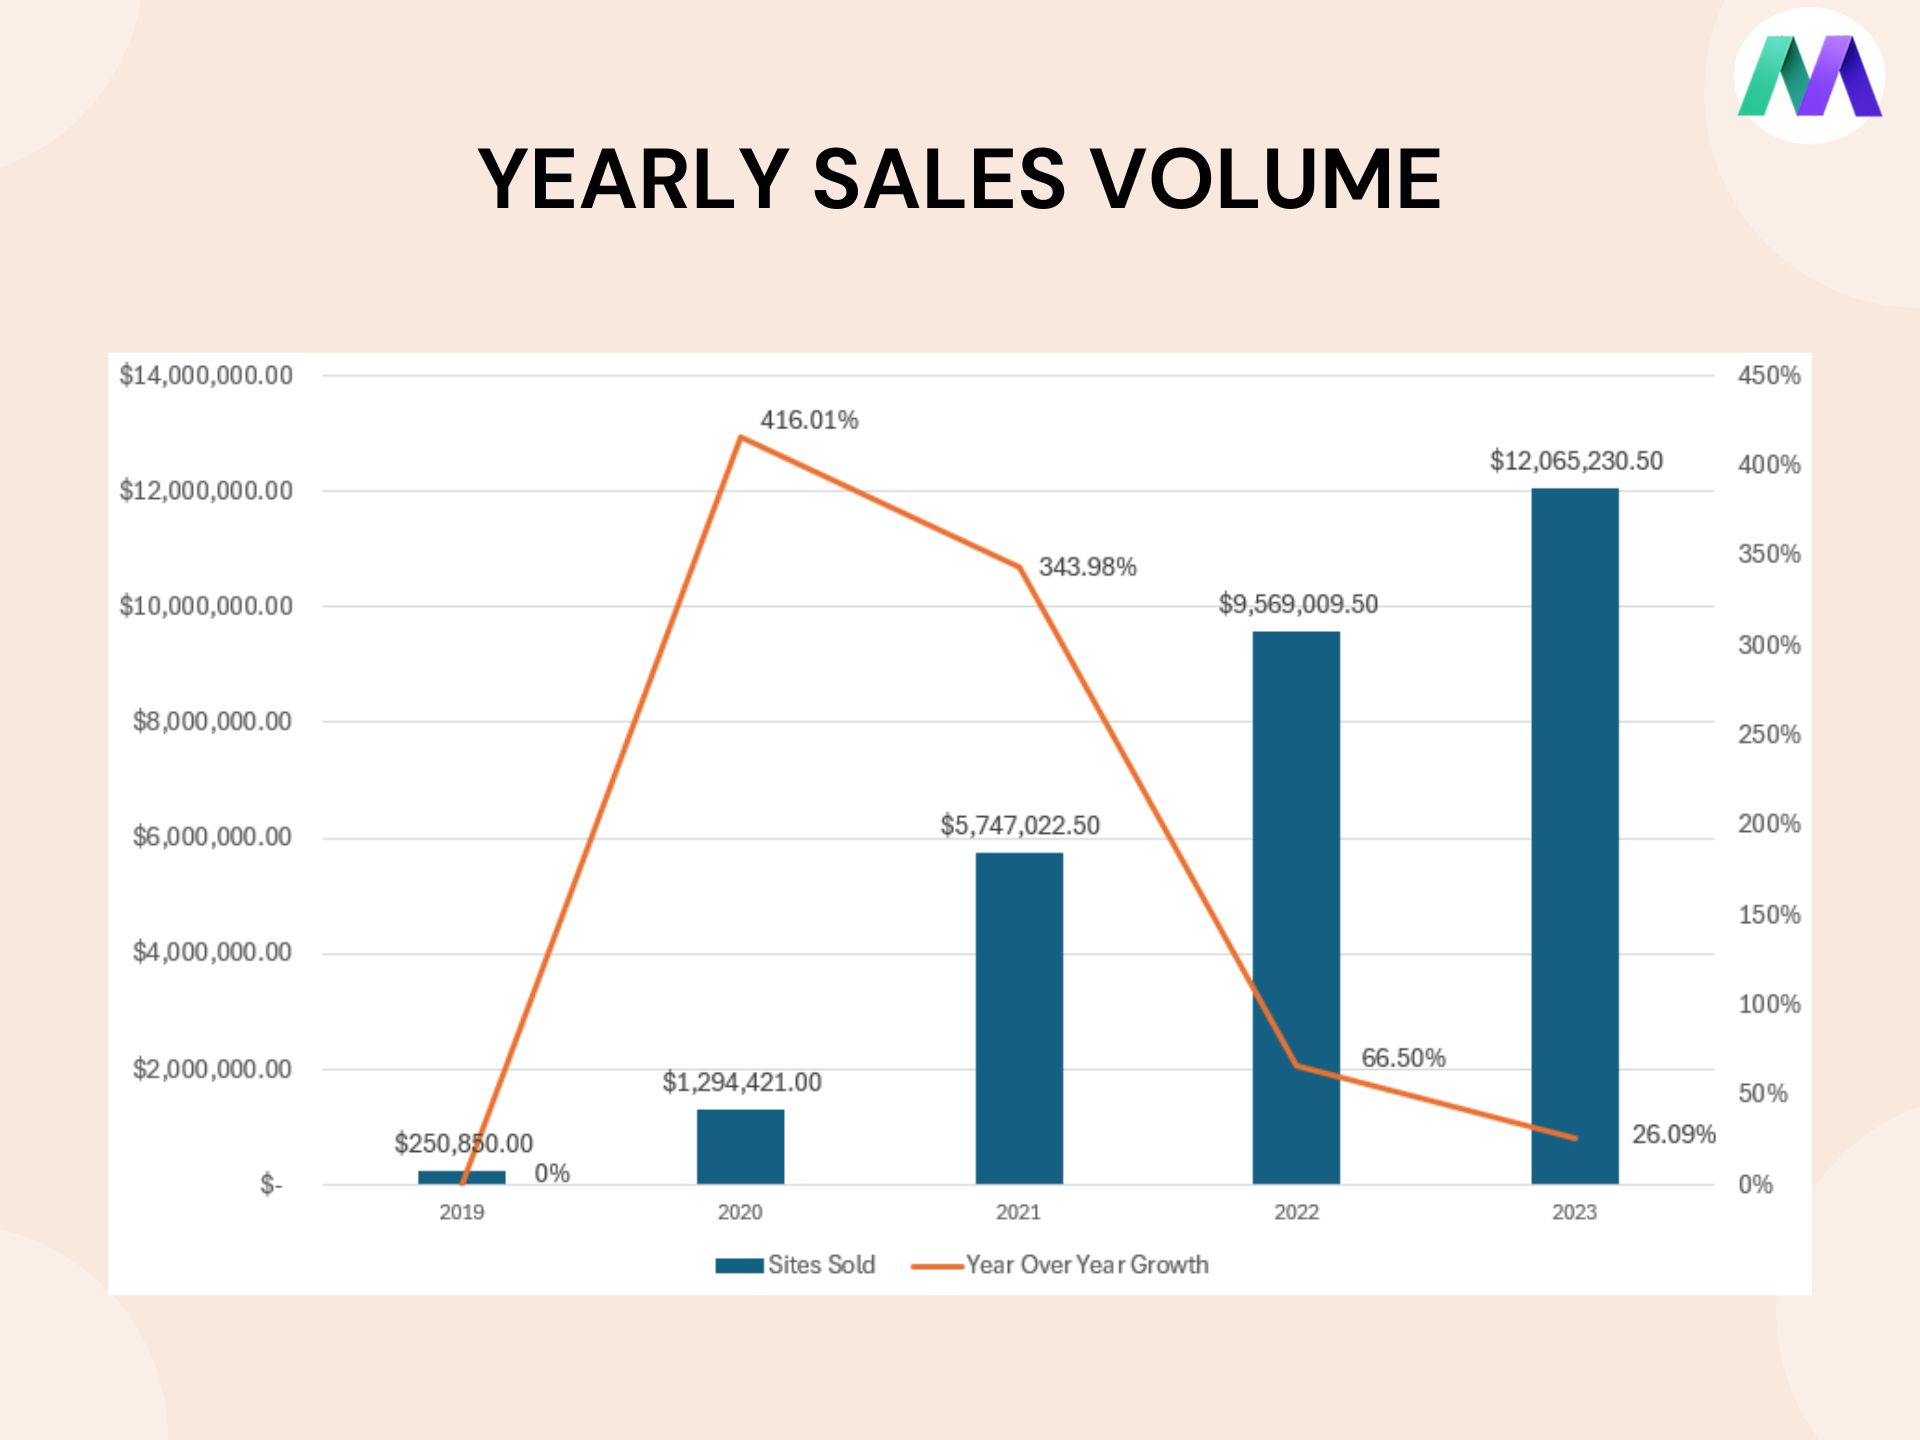
The exact numbers are:
We wanted to further analyze this data, so we checked Empire Flippers to gauge their overall sales volume.
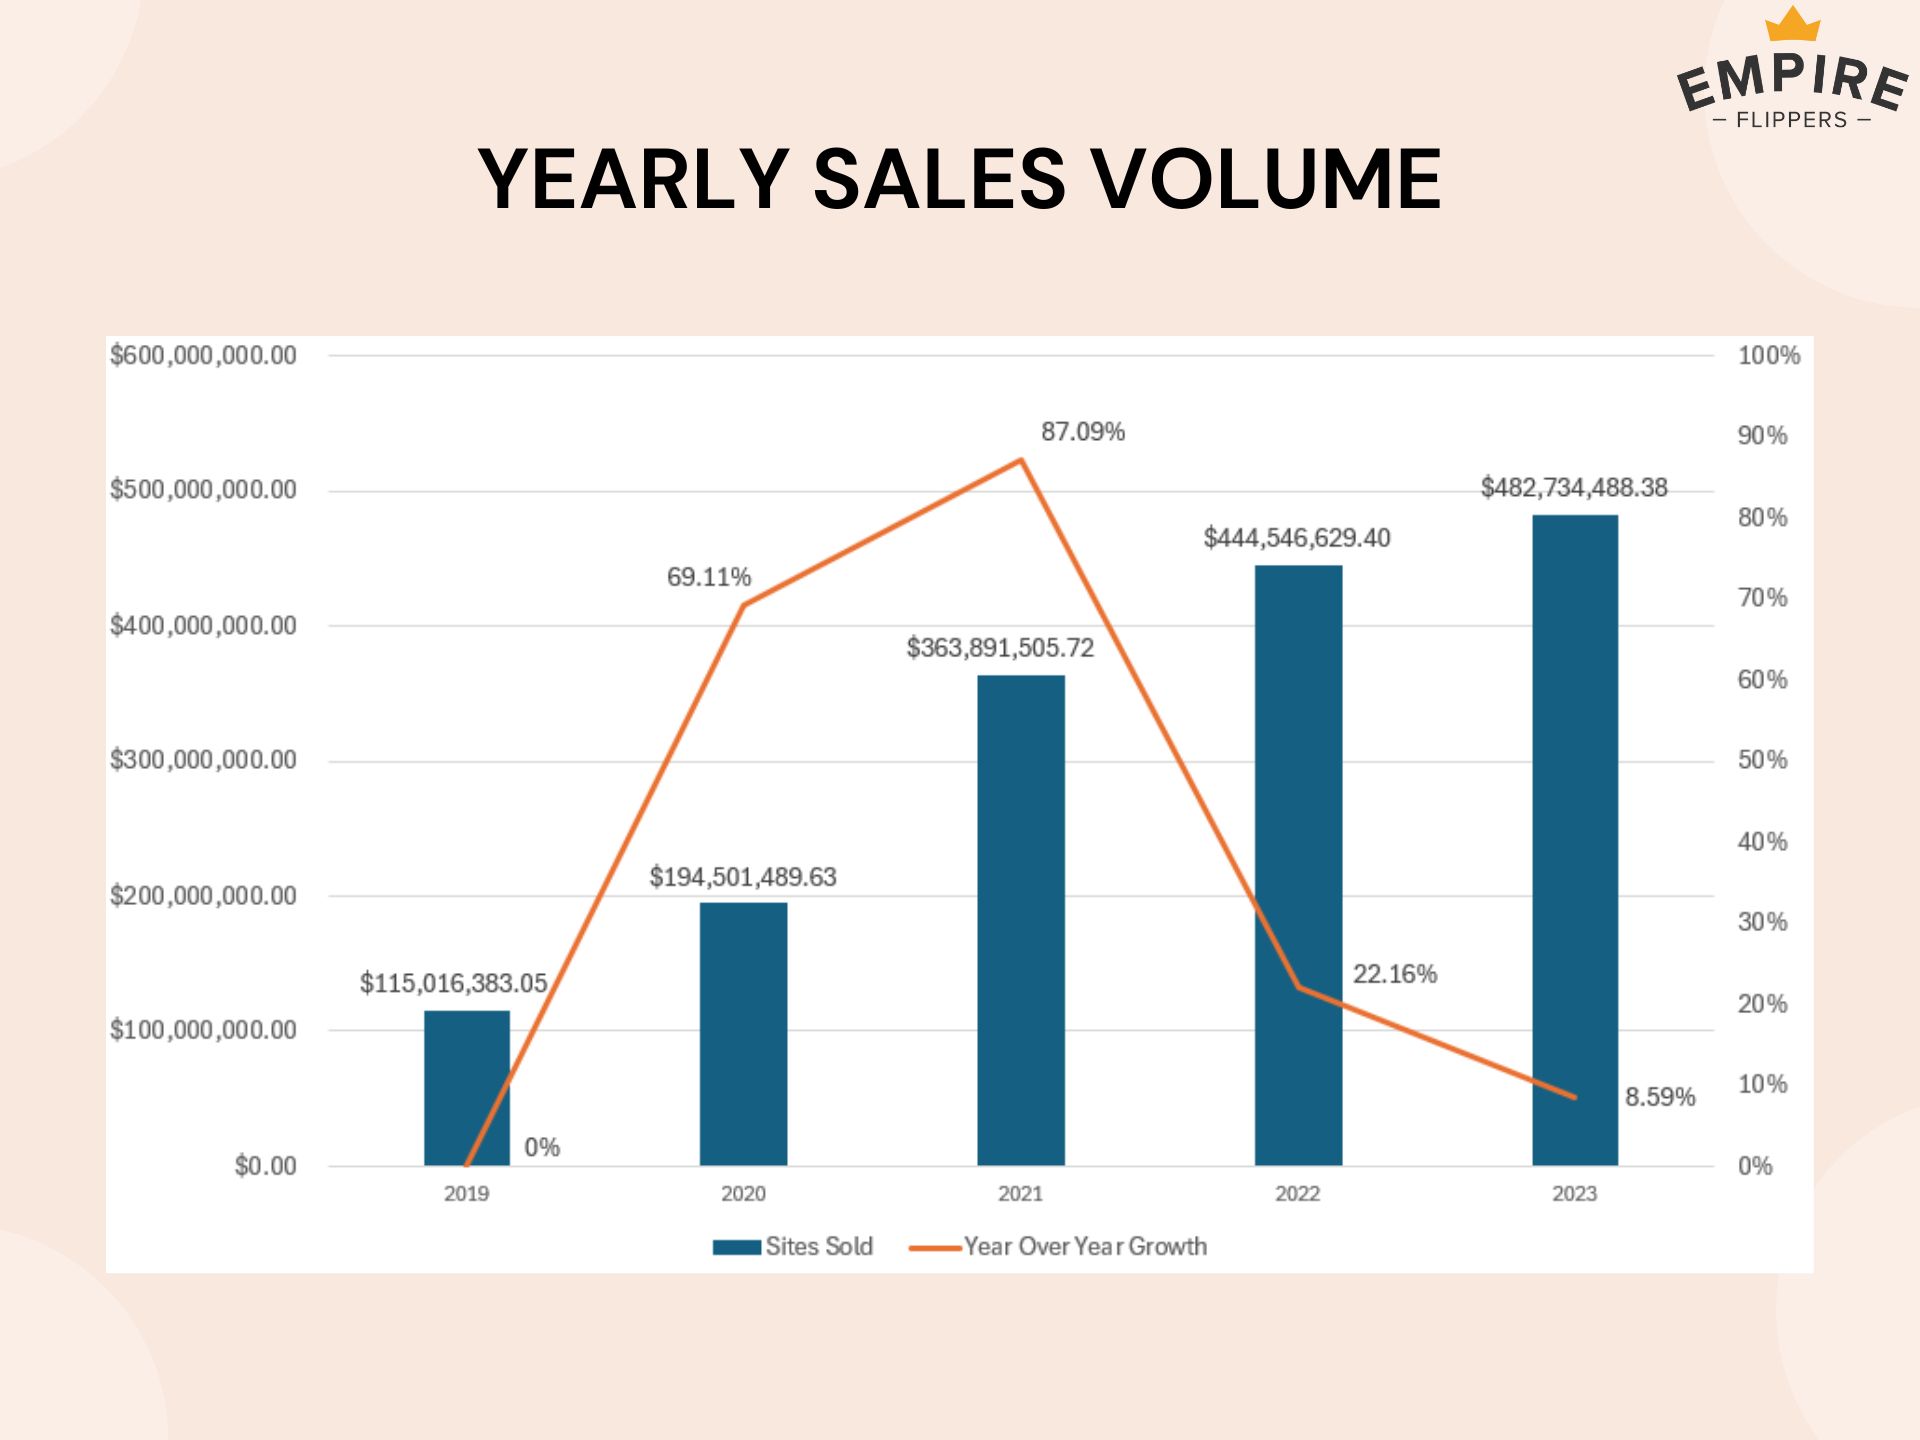
The exact numbers are:
Upon viewing these numbers, we can see that while the amount of sites sold has remained the same, total sales volume growth has slowed down in the past couple of years.
Continued upward growth in overall sales would indicate a red-hot market that clearly favors sellers. Instead, the numbers show that overall sales growth is slowing down as the market matures.
Key Takeaway – While the amount of sites sold each year remains relatively unchanged, the time it takes to sell them has increased. Also, popular marketplaces like Motion Invest and Empire Flippers are seeing a slowdown in year-over-year sales growth, which aligns with the decrease in valuation and could indicate lower demand than in previous years.
As you can see from the information above, valuation and demand have dipped slightly over the past few years. But why is that? While we don’t have the exact answer (each buyer and seller is different), there are a few macro factors that have impacted the industry as a whole.
Google’s search results are constantly changing, and the reason for this is Google updates. For site owners, “Core Updates”, “Spam Updates”, AND “Helpful Content Updates” can significantly impact traffic numbers for a website overnight.
These updates aim to assess content based on its detail, originality, and value to the reader, but unfortunately, they don’t always benefit content niche websites.
I’m sure we’ve all seen a graph like this before.
To make matters worse, there are very few examples of websites recovering from Google updates, as Google is often unclear about the cause of the drop.
Now I know what you may be thinking, Google updates aren’t exactly new. So why has it had such an impact on the market in recent months/years?
The answer is the frequency of these updates. From 2015-2020, Google rolled out anywhere between 3-6 updates a year. There was generally one core update per year, and a few other targeted rollouts, such as Project Owl or the Penguin Update.
There’s no denying that these early sites were impactful. However, because of the infrequency, there was more stability around monthly traffic and earnings for content websites. That all changed after 2020 though. Starting in 2021, Google has increased the number of updates to nine per year, and they have continued to release nine updates each subsequent year.
From Core Updates to Spam Updates to Helpful Content Updates, they are now changing ranking factors faster than many website owners can keep up, and more and more niche sites seem to be falling down the rankings because of this.
As a result of these changes, any website entirely reliant on Google for traffic will now be seen as significantly riskier by investors now than it would have been in 2019 or 2020. This has a direct impact on multiples and overall demand for content websites.
Key Takeaway – Google updates have hurt many content websites, causing a drop in traffic leading to lower income, and a lower sales multiple.
One macro aspect we have not discussed this far is the change in interest rates since the pandemic. When we started Motion Invest in 2019, interest rates were hovering around 1.5%. This dropped to 0.25% in 2020 and remained there until mid-2022 when they began to rise again.
In the two years between mid-2020 to mid-2022, there was almost zero downside to taking on debt, and this meant buyers had access to more capital, which we believe had an impact on the overall valuation of websites.
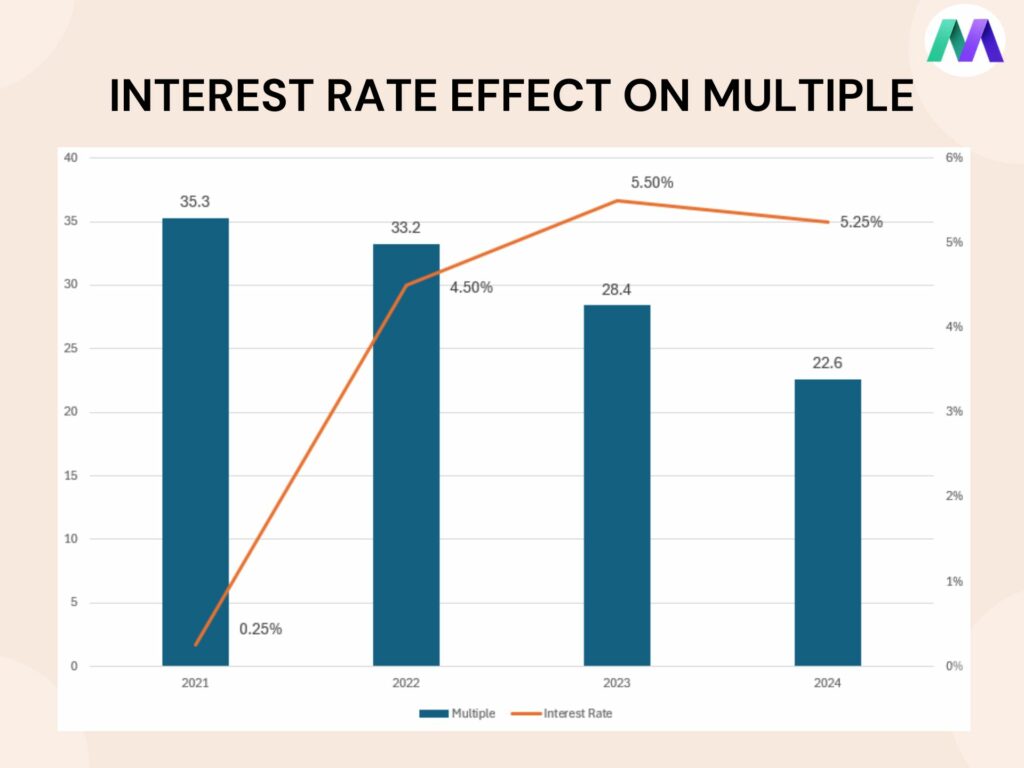
To better illustrate this impact, we have charted the average yearly income multiple for the past 4 years and included the high point for the interest rate in each year. While there are other factors at play, you’ll see that there does seem to be a correlation between high interest rates and low website multiples.
These are the stats from Motion Invest:
And these are the stats from Empire Flippers Sales:
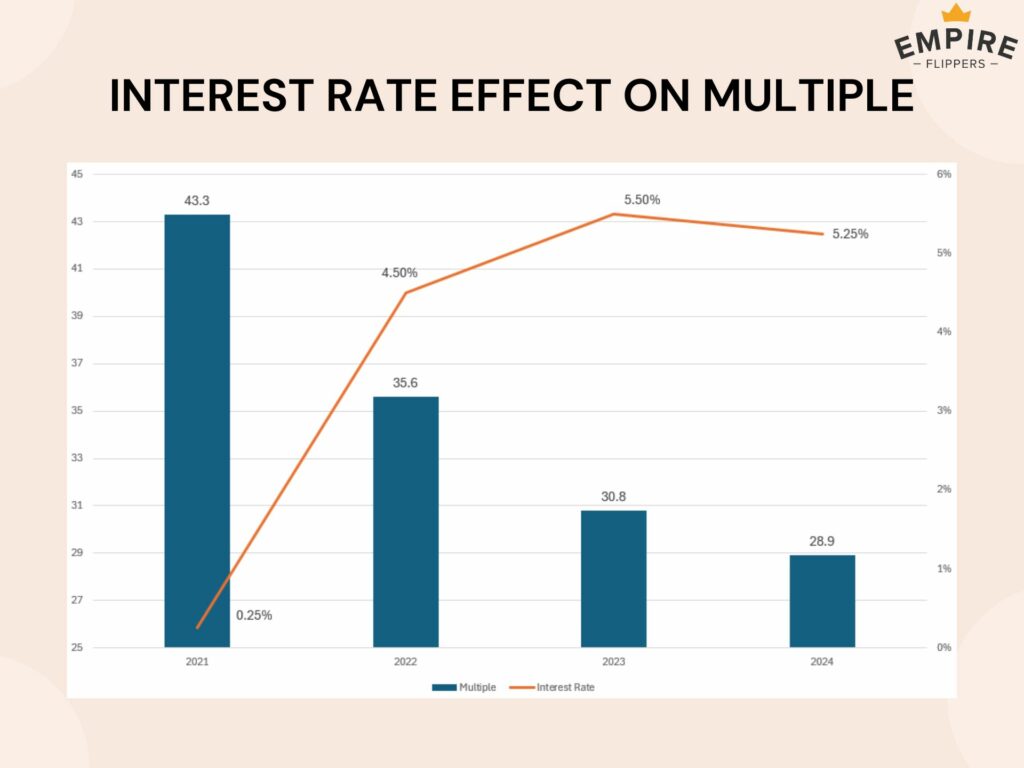
*EF 2024 Multiple may include months from 2023. Either way, it is showing a continued downtrend.
Key Takeaway – Higher interest rates mean less access to capital and more hesitancy with borrowing capital, leading to buyers with fewer funds and inevitably lower multiples.
So far we have looked at year-over-year stats, but they do not provide much insight into the current state of the market for the 2024 calendar year.
Long story short, the downward trend that began in 2022 has continued into 2024, with the seismic Google update in March putting the market at a near standstill.
Below, we have charted the average multiple and the number of sites sold each month in our marketplace. You can see a clear drop-off in March, which is when the Core Update dropped.
March 2024 saw the lowest amount of sites sold and the lowest average income multiple observed in our stats. There has been a slight uptick since, and we see 18x being the low point for website multiples, but how long this environment lasts is anyone’s guess.
Key Takeaway – Marketplace activity and website valuations continue to trend downwards in 2024.
Based on all the stats we have outlined, we firmly believe we are in a buyer’s market for the following reasons.
Key Takeaway – Now is as good of a time as ever to consider buying a content website. Plenty of inventory is available, competition is low, and sites can be bought at a fraction of the price than previous years.
Just because the average website multiple is lower than in previous years, it does not mean that high-quality websites are selling for any less. In the past 2 months, we have observed numerous websites selling for roughly 35x. Here are a few examples.
These three sites don’t have a lot in common, with each of them possessing unique stats and strengths. What they do have in common though, is they all sold much quicker and at a higher valuation than the average website.
So, there are still examples of highly-valued and highly sought-after sites. But there’s something else important to remember here, no market lasts forever, and just as quickly as the market has shifted to a buyer’s market, it can flip back to a seller’s market.
What would need to happen for this to occur? Here are some potential catalysts that could significantly alter market dynamics or the valuation of a website.
Key Takeaway – Average income multiples are not the end-all-be-all. There is and will always be demand for great content websites, and any of these catalysts occurring could lead to a significant market shift.
In the 5 years we have been running Motion Invest, we’ve seen the market transition from a strong seller’s market, to a strong buyer’s market. But we do not see this current market state lasting forever.
As we near what we would call “the bottom” of the content website industry, we believe we are in a peak buyers market, as sites can be purchased for low costs, while still having ample opportunity for growth moving forward.
So, what do you think? Having seen all the numbers – would you consider now a better time to buy or sell a website?

Motion Invest has helped thousands of entrepreneurs just like you to sell and buy websites.
Please fill out the form below to submit an offer. Please note that for new sites we usually don’t look to offers for the first 48 hours.
Please fill out the form below to submit an offer. Please note that for new sites we usually don’t look to offers for the first 48 hours.
Please submit an offer below. Please note that offers usually take 48 hours to sort through.